Enzyme engineering
TrpB · Tryptophan synthase β-subunit
This tutorial demonstrates how to compare the topographical features of multiple landscapes with GraphFLA. To see how this works, we’ll build and analyse ten fitness landscapes of the enzyme tryptophan synthase β-subunit (TrpB) from Johnston et al. (2024), and run each analysis on all of them.

Download notebook Notebook + data
Run the notebook in Google Colab, or download it to run locally. It downloads its data when no data/ folder is beside it.
1. Setting up
On Google Colab, the cell below installs GraphFLA. In any environment, it also downloads the datasets into a data/ folder next to the notebook if the files are not already there.
We then import GraphFLA for landscape construction and analysis, pandas for working with the data, and Matplotlib for the figures.
import sys
from pathlib import Path
from urllib.request import urlretrieve

if "google.colab" in sys.modules:
    %pip install -q graphfla==0.4.0

LANDSCAPES = {
    "4-site": "data/trpb_4site.csv",
    "3-site A": "data/trpb_3site_a.csv",
    "3-site B": "data/trpb_3site_b.csv",
    "3-site C": "data/trpb_3site_c.csv",
    "3-site D": "data/trpb_3site_d.csv",
    "3-site E": "data/trpb_3site_e.csv",
    "3-site F": "data/trpb_3site_f.csv",
    "3-site G": "data/trpb_3site_g.csv",
    "3-site H": "data/trpb_3site_h.csv",
    "3-site I": "data/trpb_3site_i.csv",
}
DATA_URL = "https://raw.githubusercontent.com/COLA-Laboratory/GraphFLA/v0.4.0/tutorials/datasets/"
Path("data").mkdir(exist_ok=True)
for path in LANDSCAPES.values():
    if not Path(path).exists():
        urlretrieve(DATA_URL + path, path)
import warnings

from graphfla import analysis
from graphfla.landscape import ProteinLandscape
import matplotlib.pyplot as plt
import pandas as pd

# Section 5 counts the variants that GraphFLA drops; Section 6.2 explains the NaNs.
warnings.filterwarnings("ignore", message=".*(isolated configuration|identifiable).*")
2. Loading the datasets
The β-subunit of tryptophan synthase (TrpB) makes the amino acid tryptophan from indole and serine. Johnston et al. (2024) tied TrpB activity to the growth of Escherichia coli that cannot make tryptophan, and read out fitness by deep sequencing of pooled cultures. Starting from the thermostable variant Tm9D8*, they mutated residues near the active site to all 20 amino acids. The study contains one four-site landscape with 20⁴ = 160,000 variants and nine three-site landscapes, A to I, with 20³ = 8,000 variants each. The authors built the three-site landscapes first, as preliminary screens that helped them choose the four sites of the larger one:
| Landscape | Positions |
|---|---|
| 4-site | 183, 184, 227, 228 |
| 3-site A | 104, 105, 106 |
| 3-site B | 105, 106, 107 |
| 3-site C | 106, 107, 108 |
| 3-site D | 117, 118, 119 |
| 3-site E | 184, 185, 186 |
| 3-site F | 162, 166, 301 |
| 3-site G | 227, 228, 301 |
| 3-site H | 228, 230, 231 |
| 3-site I | 182, 183, 184 |
Not every variant was measured: for the four-site landscape, 159,129 variants (99.45%) had enough sequencing reads, and the authors imputed the other 871 with a k-nearest-neighbours model. Most variants in every landscape are inactive. The authors therefore classified each measured variant as active or inactive.
We’ll maximise this fitness. On the authors’ scale, the fittest variant of each landscape has a fitness of about 1, and inactive variants are close to 0.
| Column | Meaning |
|---|---|
sequence |
Amino acids at the mutated positions, in the order listed above. |
fitness |
Growth-based fitness, scaled so that the fittest variant is close to 1. |
active |
Whether the authors classified the variant as active. |
imputed |
Whether the fitness was imputed rather than measured. |
Let’s load every landscape into a dictionary and look at the first rows of the four-site landscape:
data = {name: pd.read_csv(path) for name, path in LANDSCAPES.items()}
data["4-site"].head()
Output
| sequence | fitness | active | imputed | |
|---|---|---|---|---|
| 0 | AAAA | 0.074455 | True | False |
| 1 | AAAC | 0.056314 | True | False |
| 2 | AAAD | 0.014342 | False | False |
| 3 | AAAE | 0.012914 | False | False |
| 4 | AAAF | 0.005161 | False | False |
3. Preparing the inputs
To construct a landscape, GraphFLA needs two aligned inputs:
X: one row per configuration and one column per variable.f: one measured or calculated outcome for each row ofX.
The amino-acid sequence forms X, and fitness forms f. ProteinLandscape reads each sequence string as one position per letter, with the 20 amino acids as the alphabet. The same two columns serve for every landscape, so we show them for the four-site landscape only.
X = data["4-site"]["sequence"]
f = data["4-site"]["fitness"]
X.head()
Output
0    AAAA
1    AAAC
2    AAAD
3    AAAE
4    AAAF
Name: sequence, dtype: object
4. Constructing the landscapes
To construct the TrpB landscapes, we use the ProteinLandscape class. We set maximize=True because higher fitness is better. With epsilon=0, any fitness difference counts as an improving move, as in the original analysis.
Fitness differences between inactive variants are mostly measurement noise, so we build two landscapes from each dataset. The first holds every variant, including the imputed ones, so that a peak can be tested against all of its neighbours. The second holds only the active variants, the set in which Johnston et al. quantified epistasis and navigability. We use the first only to count peaks (Section 6.1) and the second for all other analyses.
landscapes = {}
active_landscapes = {}
for name, df in data.items():
    landscapes[name] = ProteinLandscape(maximize=True).build_from_data(
        df["sequence"], df["fitness"], epsilon=0, verbose=False,
    )
    active_df = df[df["active"]]
    active_landscapes[name] = ProteinLandscape(maximize=True).build_from_data(
        active_df["sequence"], active_df["fitness"], epsilon=0, verbose=False,
    )
5. Inspecting the landscapes
Let’s first look at what we’ve built. Printing a landscape shows its variables, configurations, improving edges and local optima:
for name, landscape in landscapes.items():
    print(f"{name}: {landscape}")
Output
4-site: ProteinLandscape(kind='protein'): 4 variables, 160000 configurations, 6079800 edges, 797 local optima
3-site A: ProteinLandscape(kind='protein'): 3 variables, 7971 configurations, 226368 edges, 62 local optima
3-site B: ProteinLandscape(kind='protein'): 3 variables, 7996 configurations, 227773 edges, 74 local optima
3-site C: ProteinLandscape(kind='protein'): 3 variables, 7994 configurations, 227659 edges, 60 local optima
3-site D: ProteinLandscape(kind='protein'): 3 variables, 7763 configurations, 216049 edges, 46 local optima
3-site E: ProteinLandscape(kind='protein'): 3 variables, 7964 configurations, 226111 edges, 92 local optima
3-site F: ProteinLandscape(kind='protein'): 3 variables, 7737 configurations, 214296 edges, 86 local optima
3-site G: ProteinLandscape(kind='protein'): 3 variables, 7891 configurations, 222123 edges, 76 local optima
3-site H: ProteinLandscape(kind='protein'): 3 variables, 7716 configurations, 214924 edges, 112 local optima
3-site I: ProteinLandscape(kind='protein'): 3 variables, 7784 configurations, 216498 edges, 16 local optima
The four-site landscape keeps all 160,000 variants, and each three-site landscape keeps the variants that were measured. The active landscapes are much smaller. GraphFLA drops a variant that has no neighbour among the others, so an active landscape can hold fewer variants than there are active variants:
for name, landscape in active_landscapes.items():
    n_active = data[name]["active"].sum()
    print(f"{name}: {n_active:,} active variants, {landscape.n_configs:,} in the landscape")
Output
4-site: 9,783 active variants, 9,582 in the landscape
3-site A: 59 active variants, 46 in the landscape
3-site B: 18 active variants, 10 in the landscape
3-site C: 35 active variants, 25 in the landscape
3-site D: 719 active variants, 707 in the landscape
3-site E: 161 active variants, 139 in the landscape
3-site F: 82 active variants, 68 in the landscape
3-site G: 108 active variants, 94 in the landscape
3-site H: 53 active variants, 33 in the landscape
3-site I: 2,494 active variants, 2,494 in the landscape
For a closer look at individual variants, we can call get_data() on the four-site landscape. The four amino acids appear as pos_0 to pos_3; out_degree counts directly improving moves, and is_lo indicates local-optimum membership.
landscapes["4-site"].get_data().head()
Output
| pos_0 | pos_1 | pos_2 | pos_3 | fitness | plateau_id | plateau_size | in_degree | out_degree | is_lo | |
|---|---|---|---|---|---|---|---|---|---|---|
| 0 | A | A | A | A | 0.074455 | -1 | 1 | 59 | 17 | False |
| 1 | A | A | A | C | 0.056314 | -1 | 1 | 58 | 18 | False |
| 2 | A | A | A | D | 0.014342 | -1 | 1 | 39 | 37 | False |
| 3 | A | A | A | E | 0.012914 | -1 | 1 | 32 | 44 | False |
| 4 | A | A | A | F | 0.005161 | -1 | 1 | 14 | 62 | False |
We can also summarise the fitness values with pandas:
landscapes["4-site"].get_data()["fitness"].describe()
Output
count    160000.000000
mean          0.021069
std           0.059888
min          -0.164071
25%           0.001635
50%           0.012398
75%           0.023818
max           1.000000
Name: fitness, dtype: float64
Most variants are inactive, with a fitness close to zero. To inspect the fittest variant of each landscape, we can use the global-optimum node index:
for name, landscape in landscapes.items():
    optimum = landscape[landscape.go_index]
    variant = "".join(value for key, value in optimum.items() if key.startswith("pos_"))
    print(f"{name}: {variant}, fitness {optimum['fitness']:.3f}")
Output
4-site: AIKG, fitness 1.000
3-site A: AET, fitness 1.000
3-site B: ETG, fitness 1.000
3-site C: TGA, fitness 1.000
3-site D: TAT, fitness 0.998
3-site E: LGS, fitness 1.000
3-site F: LIY, fitness 1.000
3-site G: GGY, fitness 1.000
3-site H: GGG, fitness 1.000
3-site I: YSL, fitness 1.000
6. Analysing the landscapes
Next, we’ll follow three questions in turn: how rugged the landscapes are (6.1–6.2), which kinds of epistasis make them so (6.3–6.6), and whether evolution can still reach the best variant (6.7–6.8). Each analysis runs on all ten landscapes, so that we can compare them.
6.1 Number of local optima
We can start with landscape.n_lo. A local optimum, or fitness peak, is a variant without a fitter single-mutant neighbour; each connected neutral plateau of peaks counts once. Many peaks mean that adaptive walks, which accept only fitness-increasing mutations, can end at different variants.
for name, landscape in landscapes.items():
    print(f"{name}: {landscape.n_lo} local optima")
Output
4-site: 797 local optima
3-site A: 62 local optima
3-site B: 74 local optima
3-site C: 60 local optima
3-site D: 46 local optima
3-site E: 92 local optima
3-site F: 86 local optima
3-site G: 76 local optima
3-site H: 112 local optima
3-site I: 16 local optima
Most of these peaks are inactive variants, whose fitness differences are noise. Johnston et al. counted only peaks that are active, measured variants. To do the same, we can flag each peak with the active column of the data: the node index of a variant is its row in the table, and imputed variants are never active.
active_peaks = {}
for name, landscape in landscapes.items():
    peaks = landscape.get_data(lo_only=True).assign(active=data[name]["active"])
    active_peaks[name] = int(peaks["active"].sum())
    print(f"{name}: {active_peaks[name]} active local optima")
Output
4-site: 520 active local optima
3-site A: 23 active local optima
3-site B: 12 active local optima
3-site C: 18 active local optima
3-site D: 30 active local optima
3-site E: 52 active local optima
3-site F: 18 active local optima
3-site G: 23 active local optima
3-site H: 29 active local optima
3-site I: 15 active local optima
This reproduces the 520 peaks reported by Johnston et al. for the four-site landscape, 5.3% of its 9,783 active variants. The imputed variants are never counted as peaks, but they take part as neighbours: without them, five more variants would count as peaks. Here are the three fittest peaks:
peaks = landscapes["4-site"].get_data(lo_only=True).assign(active=data["4-site"]["active"])
peaks[peaks["active"]].nlargest(3, "fitness")
Output
| pos_0 | pos_1 | pos_2 | pos_3 | fitness | plateau_id | plateau_size | active | |
|---|---|---|---|---|---|---|---|---|
| 2965 | A | I | K | G | 1.000000 | -1 | 1 | True |
| 11765 | C | L | K | G | 0.932034 | -1 | 1 | True |
| 139635 | V | L | C | S | 0.752895 | -1 | 1 | True |
They are the variants AIKG, CLKG and VLCS that Johnston et al. describe as the first, second and third fittest peaks.
6.2 Roughness-to-slope ratio
The peak count shows that the landscapes are rugged, but not how far they depart from the simplest case. If every mutation had the same effect in every background, fitness would be additive and the landscape would have a single peak. The roughness-to-slope ratio, introduced by Aita et al. (2000), measures this departure: it fits an additive model and compares the scatter left unexplained with the average size of the mutation effects. Values near zero indicate a nearly additive landscape; larger values indicate a more rugged one.
r_s_ratio() encodes each position relative to a reference amino acid, so we compare values only when they are calculated in the same way. It returns nan when a landscape has too few variants to identify the additive effects. From here on, we analyse the active landscapes.
roughness_to_slope = {}
for name, landscape in active_landscapes.items():
    roughness_to_slope[name] = analysis.r_s_ratio(landscape)
    print(f"{name}: {roughness_to_slope[name]:.4f}")
Output
4-site: 1.5462
3-site A: 0.7752
3-site B: nan
3-site C: nan
3-site D: 1.3041
3-site E: 1.2958
3-site F: 0.5058
3-site G: nan
3-site H: nan
3-site I: 1.1733
6.3 Gamma star
Not every departure from additivity creates peaks. A mutation that is beneficial in every background still leads uphill; multiple peaks can arise only when mutation effects reverse direction between backgrounds, known as sign epistasis. Ferretti et al. (2016) proposed measuring epistasis by how well a mutation’s effect carries over when a second mutation is added to the background. gamma_star() applies this idea to the direction of effects only; we run it in a single process (n_jobs=1), which is fast enough here.
A value of 1 means mutations never switch between beneficial and deleterious; values near zero indicate frequent switches, and negative values indicate that pairs of mutations often reverse each other’s direction (reciprocal sign epistasis).
sign_correlation = {}
for name, landscape in active_landscapes.items():
    sign_correlation[name] = analysis.gamma_star(landscape, n_jobs=1)
    print(f"{name}: {sign_correlation[name]:.4f}")
Output
4-site: 0.5063
3-site A: 0.8182
3-site B: nan
3-site C: 1.0000
3-site D: 0.4016
3-site E: 0.7436
3-site F: 0.3509
3-site G: 0.3138
3-site H: 0.2667
3-site I: 0.4520
6.4 Idiosyncratic epistasis
Gamma star records only whether effects change direction. Even when the direction holds, the size of an effect can change from one background to another. Lyons et al. (2020) introduced the idiosyncratic index to measure this variation: it compares the spread of a mutation’s effects across backgrounds with the fitness differences between randomly paired variants. A value of zero means each mutation has the same effect everywhere; a value near one means its effect varies about as much as the difference between two random variants.
global_idiosyncratic_index() averages this index over all mutations. Random pairs are drawn with a fixed seed.
idiosyncrasy = {}
for name, landscape in active_landscapes.items():
    idiosyncrasy[name] = analysis.global_idiosyncratic_index(landscape, seed=42, n_jobs=1)
    print(f"{name}: {idiosyncrasy[name]:.4f}")
Output
4-site: 0.6655
3-site A: 1.3856
3-site B: nan
3-site C: nan
3-site D: 0.9682
3-site E: 8.2313
3-site F: 1.7205
3-site G: 1.5987
3-site H: 1.7723
3-site I: 0.6612
6.5 Types of epistasis
Gamma star and the idiosyncratic index each reduce epistasis to a single number. classify_epistasis() instead sorts pairs of mutations into types. For each square of four variants (the background, two single mutants and the double mutant), it asks how the effect of one mutation changes when the other is present: magnitude epistasis changes only the size of the effect, sign epistasis reverses the effect of one mutation, and reciprocal sign epistasis reverses both. It returns the proportion of each type among the squares in the landscape. In an active landscape, all four variants of every square are active.
We count every square exactly with sample_cut_prob=0, which takes about 20 seconds for the four-site landscape and much less for the others. A landscape without a square has no proportions, so we leave them empty.
epistasis = {}
for name, landscape in active_landscapes.items():
    epistasis[name] = analysis.classify_epistasis(landscape, sample_cut_prob=0)
pd.DataFrame(epistasis).T.round(3)
Output
| magnitude | sign | reciprocal_sign | positive | negative | |
|---|---|---|---|---|---|
| 4-site | 0.593 | 0.321 | 0.087 | 0.813 | 0.187 |
| 3-site A | 0.909 | 0.000 | 0.091 | 0.727 | 0.273 |
| 3-site B | 0.000 | 0.000 | 0.000 | 0.000 | 0.000 |
| 3-site C | 1.000 | 0.000 | 0.000 | 1.000 | 0.000 |
| 3-site D | 0.531 | 0.340 | 0.129 | 0.885 | 0.115 |
| 3-site E | 0.744 | 0.256 | 0.000 | 0.897 | 0.103 |
| 3-site F | 0.509 | 0.333 | 0.158 | 0.860 | 0.140 |
| 3-site G | 0.443 | 0.428 | 0.129 | 0.915 | 0.085 |
| 3-site H | 0.400 | 0.467 | 0.133 | 0.933 | 0.067 |
| 3-site I | 0.560 | 0.332 | 0.108 | 0.839 | 0.161 |
The positive and negative columns split the same squares by whether the double mutant is fitter or less fit than the sum of the single-mutation effects predicts. The first three columns add up to one, so we can plot them side by side:
types = pd.DataFrame(epistasis).T[["magnitude", "sign", "reciprocal_sign"]] * 100
types.columns = ["magnitude", "single sign", "reciprocal sign"]
types[types.sum(axis=1) == 0] = float("nan")
ax = types.plot.bar(
    stacked=True, rot=45, color=["lightgray", "gray", "black"],
    ylabel="Frequency of epistasis (%)",
)
ax.legend(loc="center left", bbox_to_anchor=(1, 0.5))
plt.show()
Output
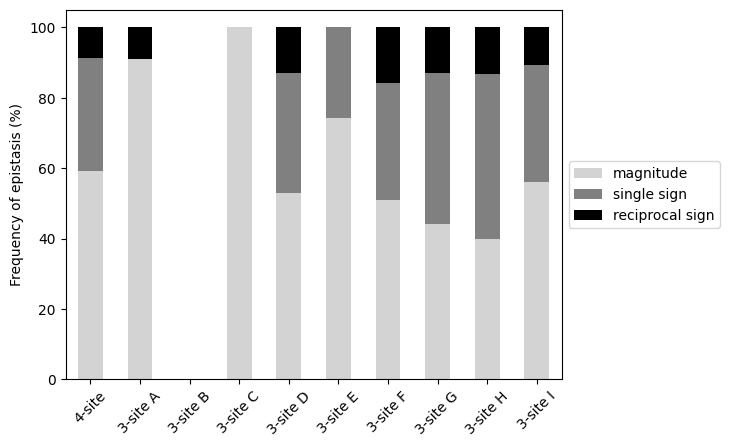
In the four-site landscape, 59% of squares show only magnitude epistasis, 32% single sign epistasis and 9% reciprocal sign epistasis. These proportions agree with the averages that Johnston et al. report for the active variants (58%, 33% and 9%), which they take over starting variants rather than over squares. The three-site landscapes D and I, which have the most active variants, show a similar mix. Landscapes with few active variants contain few squares, so their proportions are coarse, and 3-site B has no square at all.
6.6 Diminishing returns and increasing costs
Interactions between particular positions are one source of background dependence. Another is a general trend with how fit the background already is, known as global epistasis. Beneficial mutations can help less in fitter backgrounds, known as diminishing returns (Chou et al., 2011), while deleterious mutations can cost more, known as increasing costs (Johnson et al., 2019).
diminishing_returns_index() correlates background fitness with the gain of each beneficial mutation; a negative value indicates diminishing returns. increasing_costs_index() correlates background fitness with the loss of each deleterious mutation; a positive value indicates increasing costs. Both pool all mutations together and depend on the fitness scale.
returns = {}
costs = {}
for name, landscape in active_landscapes.items():
    returns[name] = analysis.diminishing_returns_index(landscape)
    costs[name] = analysis.increasing_costs_index(landscape)
    print(f"{name}: diminishing returns {returns[name]:.4f}, increasing costs {costs[name]:.4f}")
Output
4-site: diminishing returns -0.0658, increasing costs 0.6971
3-site A: diminishing returns 0.0215, increasing costs 0.9048
3-site B: diminishing returns 0.9798, increasing costs 0.9969
3-site C: diminishing returns 0.5542, increasing costs 0.9269
3-site D: diminishing returns 0.0782, increasing costs 0.8740
3-site E: diminishing returns 0.1722, increasing costs 0.8646
3-site F: diminishing returns 0.1454, increasing costs 0.9607
3-site G: diminishing returns -0.0468, increasing costs 0.8123
3-site H: diminishing returns 0.1021, increasing costs 0.9041
3-site I: diminishing returns 0.0528, increasing costs 0.7880
6.7 Global optimum accessibility
Ruggedness and epistasis matter for evolution because peaks can trap adaptive walks. global_optima_accessibility() asks whether the fittest variant can still be reached: it returns the fraction of variants from which some path of fitness-increasing single mutations leads to the global optimum. A value of 1 means every variant has such a path; a small value means most adaptive walks must end at other peaks. In an active landscape, a path can use only active variants, so variants that are cut off from the global optimum count as having no path.
accessibility = {}
for name, landscape in active_landscapes.items():
    accessibility[name] = analysis.global_optima_accessibility(landscape)
    print(f"{name}: {accessibility[name]:.4f}")
Output
4-site: 0.9160
3-site A: 0.3696
3-site B: 0.3000
3-site C: 0.1600
3-site D: 0.9109
3-site E: 0.3597
3-site F: 0.8971
3-site G: 0.8617
3-site H: 0.5455
3-site I: 0.9920
6.8 Fitness-distance correlation
Accessibility tells us whether an uphill path to the global optimum exists, not whether fitness points towards it. Jones and Forrest (1995) introduced fitness-distance correlation for this question. fdc() correlates each variant’s fitness with its number of mutations from the global optimum. A negative value means fitter variants tend to lie closer to the best variant; a value near zero means distance tells us little about fitness.
fitness_distance_r = {}
for name, landscape in active_landscapes.items():
    fitness_distance_r[name] = analysis.fdc(landscape, method="spearman")
    print(f"{name}: {fitness_distance_r[name]:.4f}")
Output
4-site: -0.2879
3-site A: -0.3792
3-site B: -0.6923
3-site C: -0.0482
3-site D: -0.2176
3-site E: -0.4914
3-site F: -0.2208
3-site G: -0.3793
3-site H: -0.5037
3-site I: -0.2585
7. Comparing the landscapes
Every analysis above stored one value per landscape, so we can now line the landscapes up in a single table: the theoretical size of each landscape, how many of its variants were measured and how many are active, and its topographical features.
summary = pd.DataFrame(
    {
        "Theoretical size": {name: 20**landscape.n_vars for name, landscape in landscapes.items()},
        "Measured variants": {name: int((~df["imputed"]).sum()) for name, df in data.items()},
        "Active variants": {name: int(df["active"].sum()) for name, df in data.items()},
        "Local optima": active_peaks,
        "r/s ratio": roughness_to_slope,
        "Gamma star": sign_correlation,
        "Idiosyncratic index": idiosyncrasy,
        "Magnitude (%)": types["magnitude"],
        "Single sign (%)": types["single sign"],
        "Reciprocal sign (%)": types["reciprocal sign"],
        "Diminishing returns": returns,
        "Increasing costs": costs,
        "Accessibility": accessibility,
        "FDC": fitness_distance_r,
    },
    index=list(landscapes),
)
summary.round(3)
Output
| Theoretical size | Measured variants | Active variants | Local optima | r/s ratio | Gamma star | Idiosyncratic index | Magnitude (%) | Single sign (%) | Reciprocal sign (%) | Diminishing returns | Increasing costs | Accessibility | FDC | |
|---|---|---|---|---|---|---|---|---|---|---|---|---|---|---|
| 4-site | 160000 | 159129 | 9783 | 520 | 1.546 | 0.506 | 0.666 | 59.284 | 32.064 | 8.653 | -0.066 | 0.697 | 0.916 | -0.288 |
| 3-site A | 8000 | 7971 | 59 | 23 | 0.775 | 0.818 | 1.386 | 90.909 | 0.000 | 9.091 | 0.022 | 0.905 | 0.370 | -0.379 |
| 3-site B | 8000 | 7996 | 18 | 12 | NaN | NaN | NaN | NaN | NaN | NaN | 0.980 | 0.997 | 0.300 | -0.692 |
| 3-site C | 8000 | 7994 | 35 | 18 | NaN | 1.000 | NaN | 100.000 | 0.000 | 0.000 | 0.554 | 0.927 | 0.160 | -0.048 |
| 3-site D | 8000 | 7763 | 719 | 30 | 1.304 | 0.402 | 0.968 | 53.069 | 34.025 | 12.905 | 0.078 | 0.874 | 0.911 | -0.218 |
| 3-site E | 8000 | 7964 | 161 | 52 | 1.296 | 0.744 | 8.231 | 74.359 | 25.641 | 0.000 | 0.172 | 0.865 | 0.360 | -0.491 |
| 3-site F | 8000 | 7737 | 82 | 18 | 0.506 | 0.351 | 1.720 | 50.877 | 33.333 | 15.789 | 0.145 | 0.961 | 0.897 | -0.221 |
| 3-site G | 8000 | 7891 | 108 | 23 | NaN | 0.314 | 1.599 | 44.282 | 42.815 | 12.903 | -0.047 | 0.812 | 0.862 | -0.379 |
| 3-site H | 8000 | 7716 | 53 | 29 | NaN | 0.267 | 1.772 | 40.000 | 46.667 | 13.333 | 0.102 | 0.904 | 0.545 | -0.504 |
| 3-site I | 8000 | 7784 | 2494 | 15 | 1.173 | 0.452 | 0.661 | 56.021 | 33.159 | 10.821 | 0.053 | 0.788 | 0.992 | -0.259 |
In summary, only a small part of each TrpB landscape is active: 6.1% of the four-site variants, and between 0.2% and 31% of the variants in the three-site landscapes. The four-site landscape is rugged, with 520 active peaks, 5.3% of its active variants, and an r/s ratio of 1.55. Sign epistasis is frequent (γ* = 0.506): a third of mutation squares show single sign epistasis and 9% reciprocal sign epistasis. Beneficial mutations gain slightly less (−0.066) and deleterious mutations cost more (0.697) in fitter backgrounds, and 91.6% of its active variants have a fitness-increasing path to the global optimum.
Only the three-site landscapes D and I, with 719 and 2,494 active variants, are large enough to compare with it. They show a similar mix of epistasis types (53–56% magnitude, 33–34% single sign, 11–13% reciprocal sign), but their peaks are rarer, 4.2% and 0.6% of the active variants, and the global optimum of landscape I can be reached from 99.2% of its variants. The other seven landscapes have between 18 and 161 active variants. These fall apart into several disconnected pieces, so some features cannot be computed and the others are based on few variants and squares. Their low accessibility, for example, mainly reflects this fragmentation. Comparing such landscapes reliably would need more active variants.
8. Analysis reference
For further exploration, analysis.list_metrics() lists the metrics available in GraphFLA.
Data sources
Johnston K. E. et al. (2024). A combinatorially complete epistatic fitness landscape in an enzyme active site. We use the fitness values and activity classifications from the authors’ CaltechDATA archive (CC0), keeping the variants without stop codons. The four-site landscape includes the 871 variants whose fitness the authors imputed; the three-site landscapes contain measured variants only.